eALT is a project I started about 9 months ago (June ’24) with the goal of building a low cost and mass altimeter which could fit inside a BT-20 body tube, and therefore almost any model rocket. I also wanted it to present a graph of the altitude rather than just the apogee, like other commercial solutions. I have also used this project as a way to learn how to design and construct circuit boards.
The main components are as follows:
- An ESP32 microcontroller
- A DPS368 as the altimeter
- Any 3.7v LiPo
This article acts as a summary of my progress up to the time of writing, but I plan on continuing to work on it. Any updates can be found here.
Hardware
On the hardware side of development, most work is complete, and it achieves the requirements set out above.
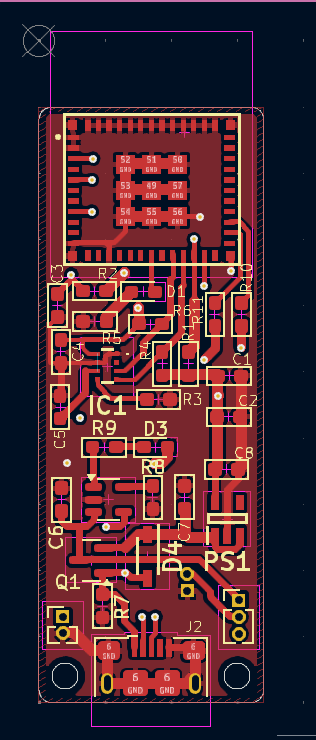
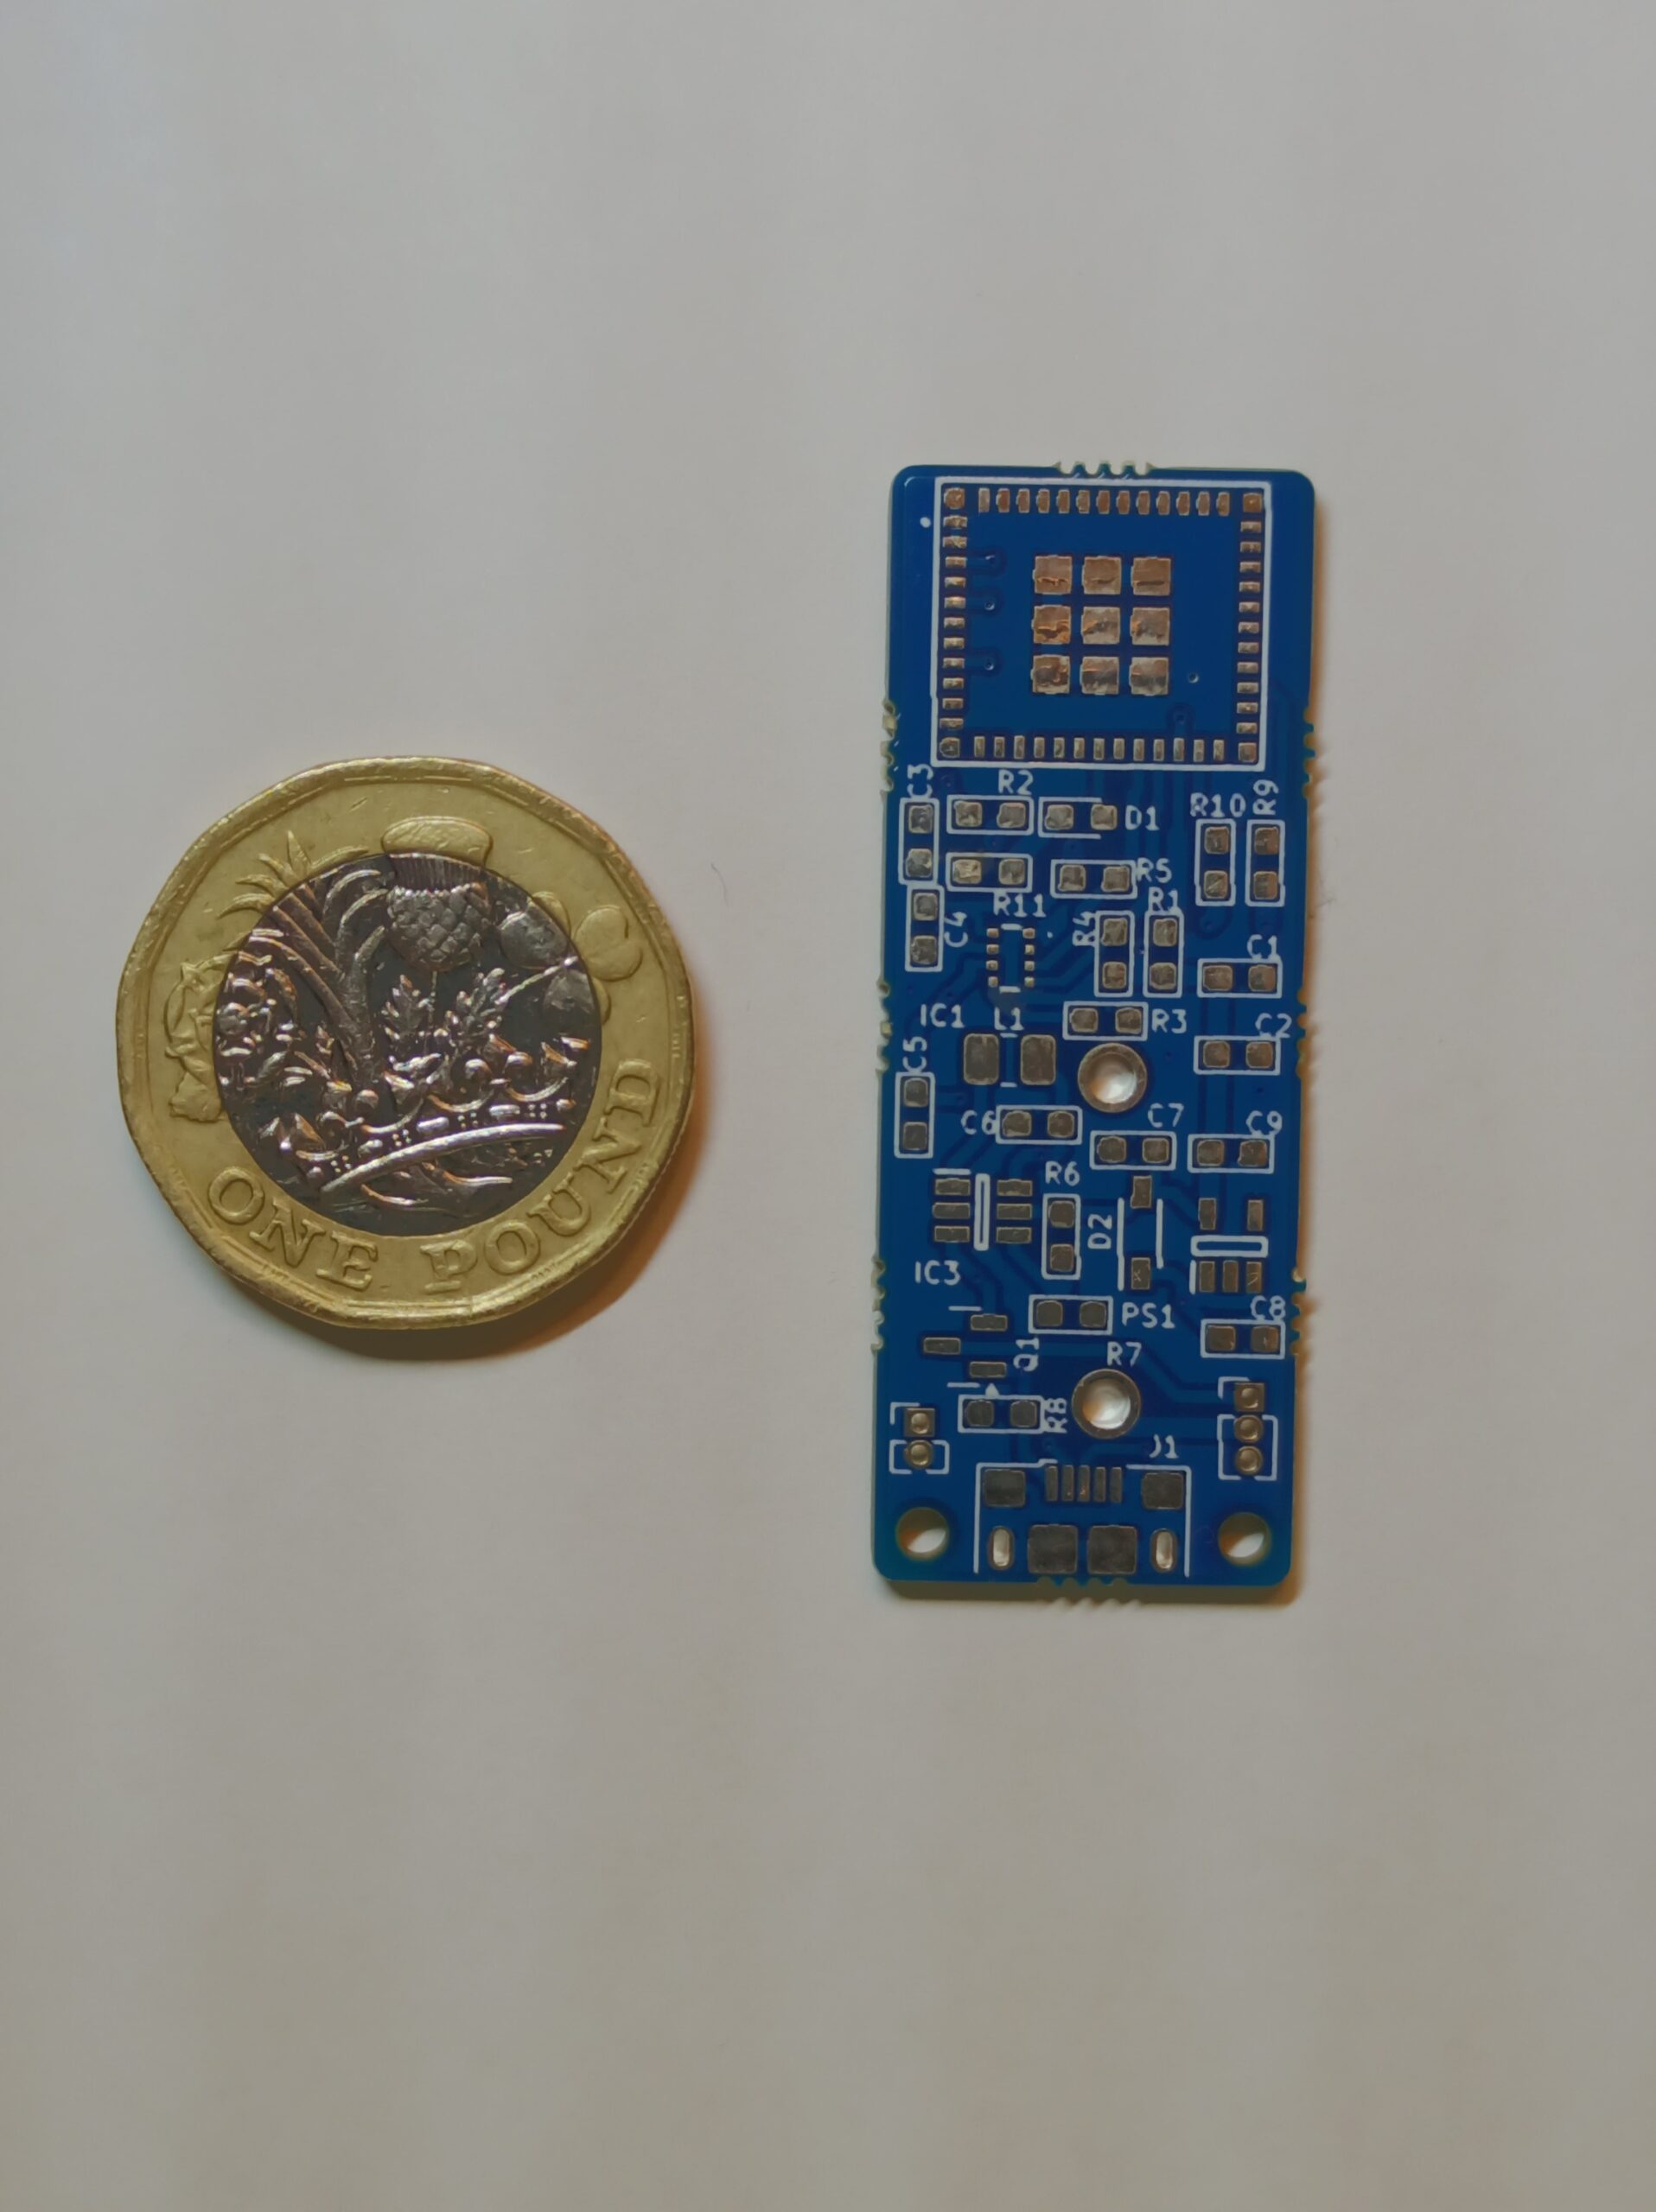
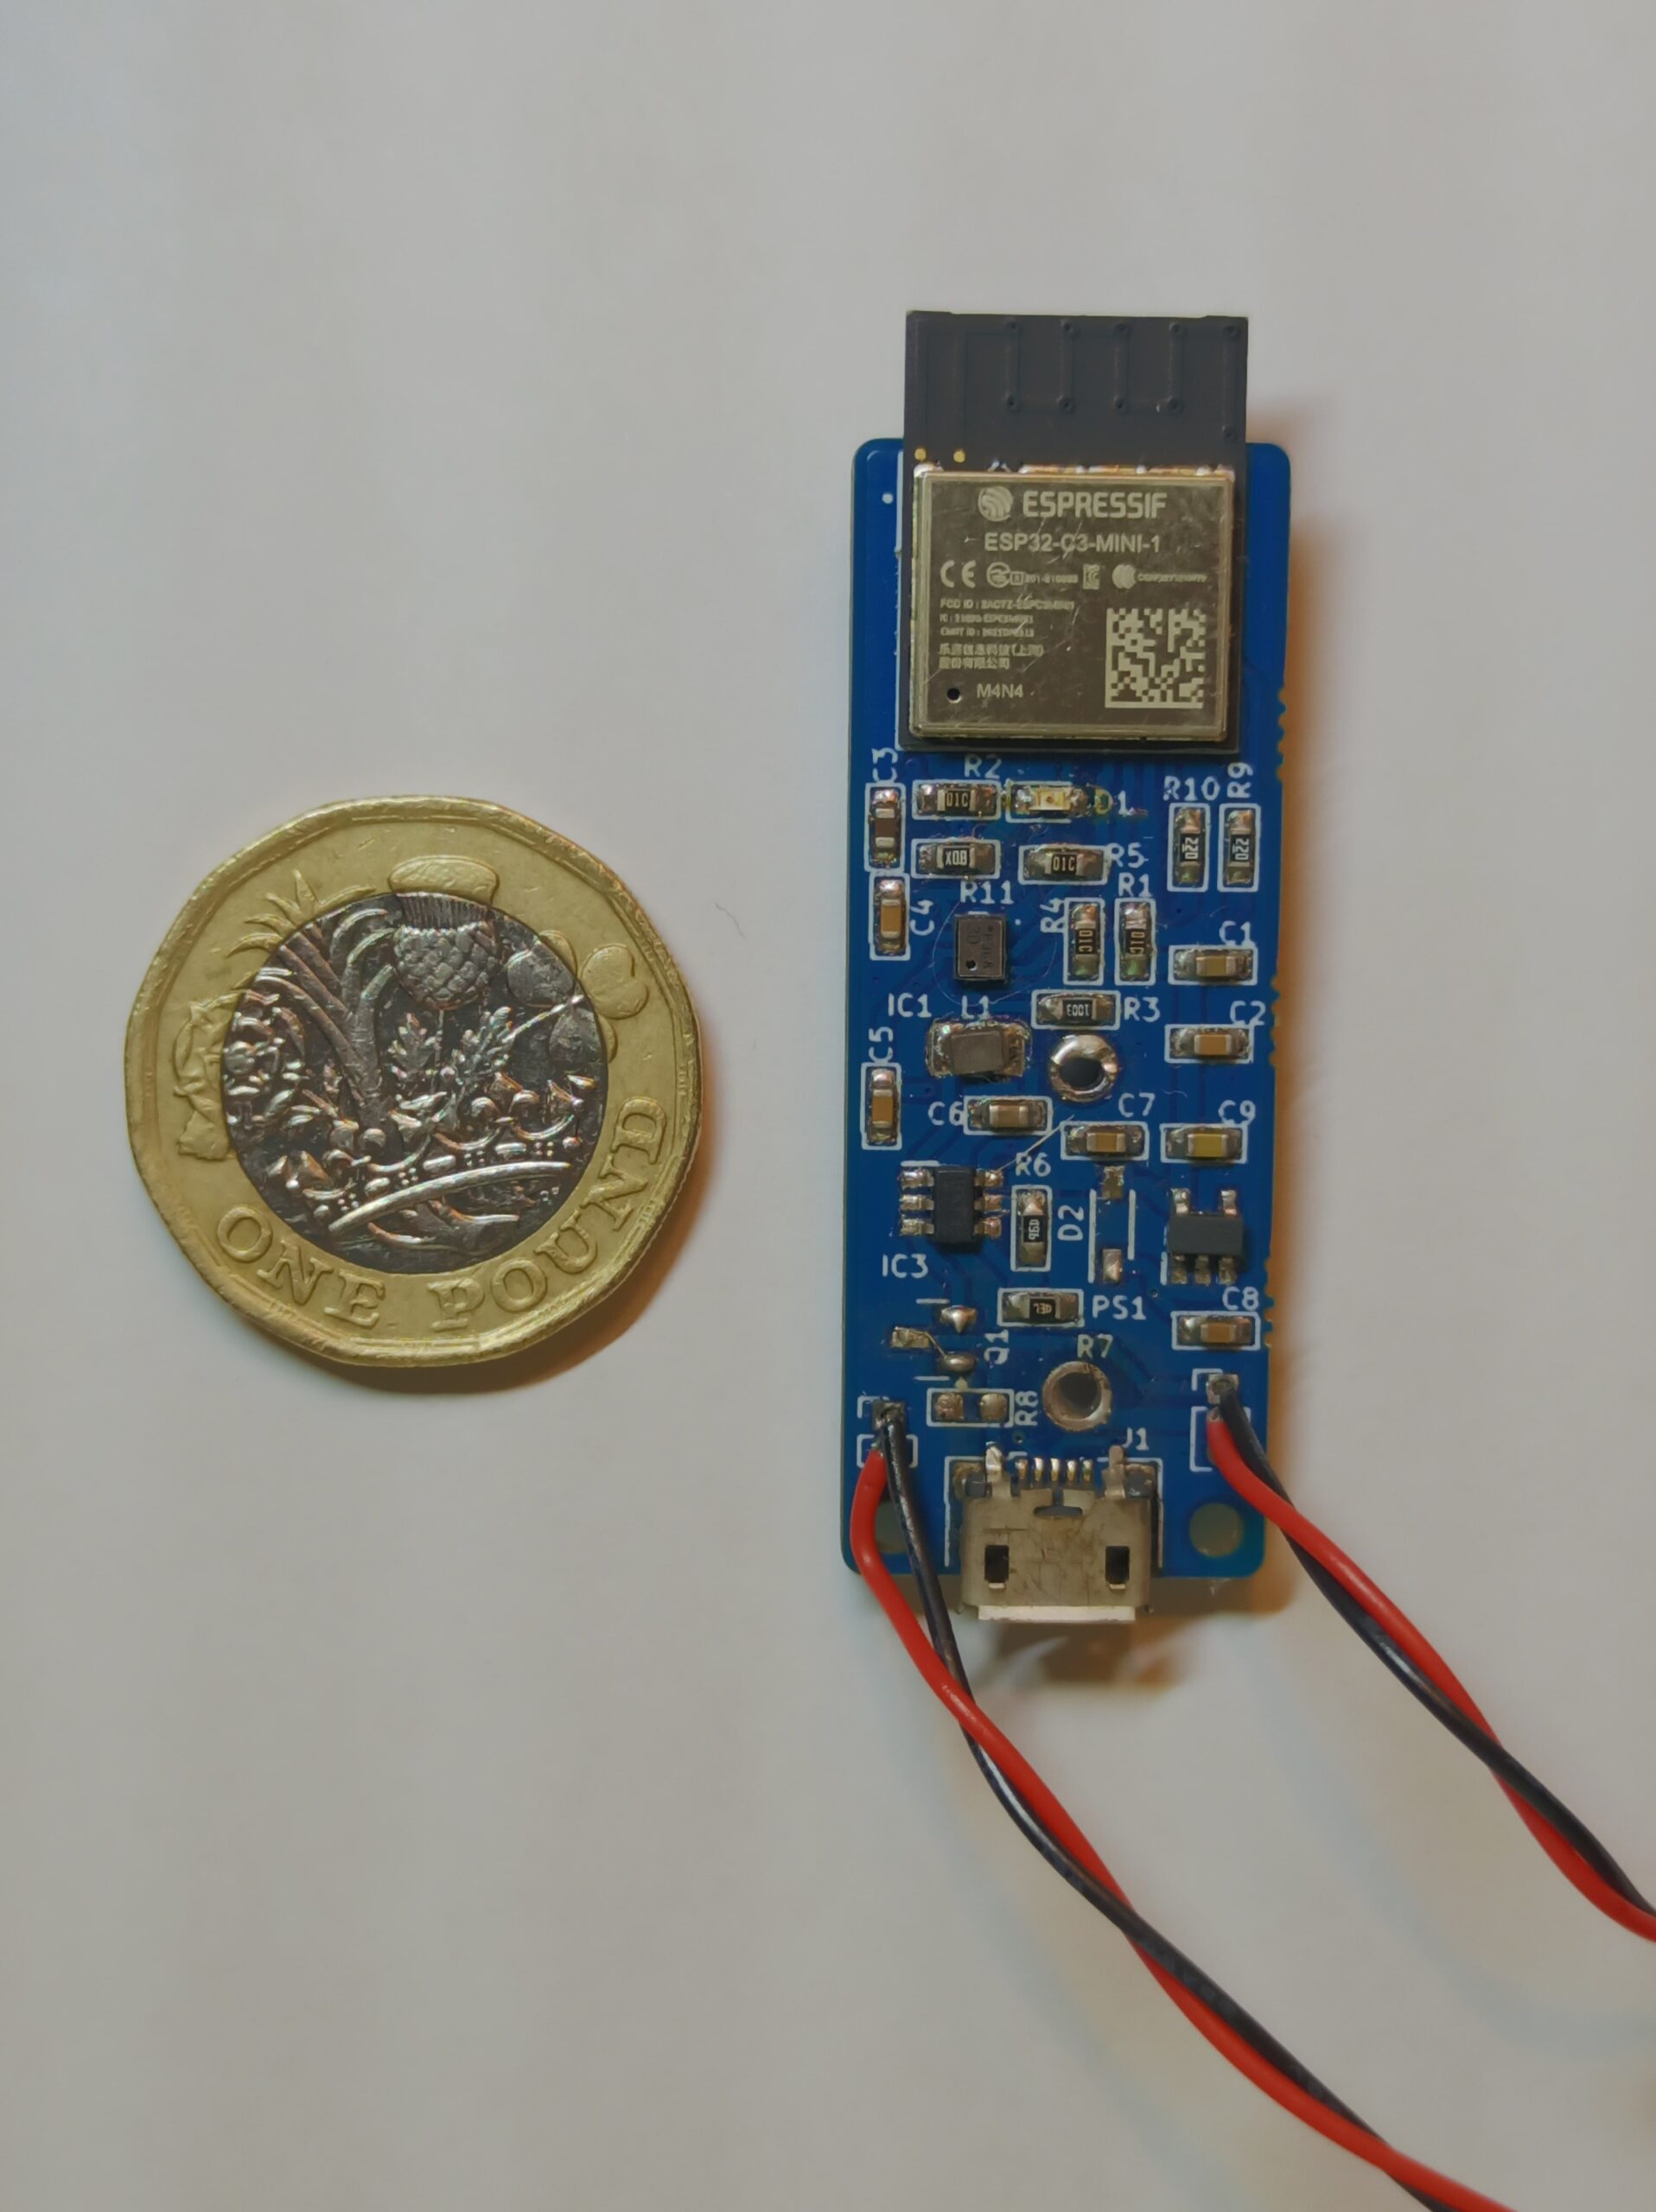
The images show both versions of the board. In the layout, it is the more recent version which has power circuitry for a LiPo. I decided to change to a LiPo after testing proved that an LR44 could not provide enough current. The physical boards show an older version of the board modified to work with the LiPo in place of the LR44, for testing.
Physically, it fits within the requirements being 17mmx45mm just about fitting within the BT-20 body tube. The wires lead to a power switch, and a button which is used for programming and board state.
To use within a rocket, holes in the body tube, and a bulkhead between the Altimeter and release charge, are needed to allow for the external pressure to be read accurately. For testing, my Dad designed a holder which provides access to the button and switch, with two holes for air, while also acting as the bulkhead.
Software
The software side of the project has had the most attention. In it’s current state, it can store 1 flights worth of data then transfer it over serial or bluetooth to a computer, which can then be displayed in a graph.
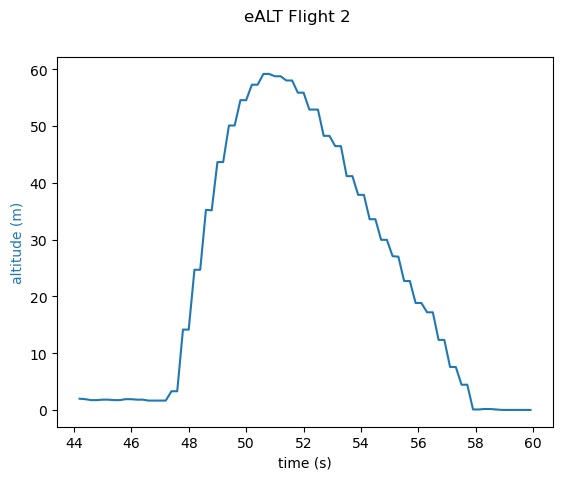
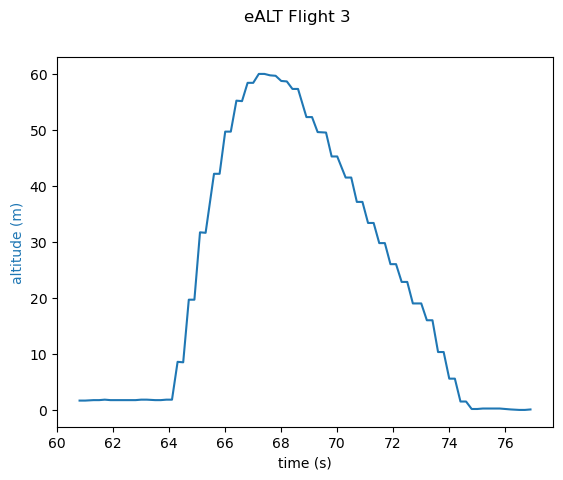
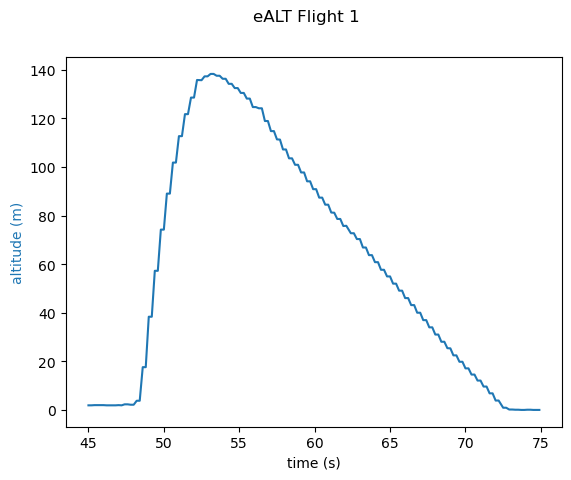
The plots above are taken from three different flights. 2 and 3 were relatively short so do not show a proper flight curve, but flight 1 used a higher power rocket motor and clearly shows the fast powered ascent and steady descent by parachute.
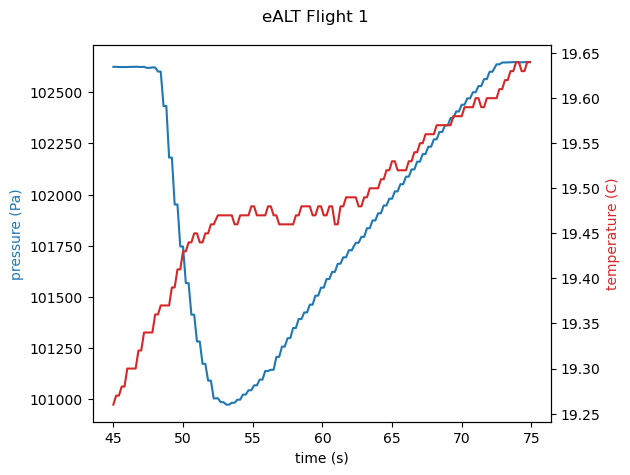
The software also plots the raw values of pressure and temperature, and shows how the shape of the pressure curve is almost a flipped version of the altitude. The increase in temperature is due to the board heating up with use, it can heat up to 40 ° but is unrelated to the altitude.
The jagged lines shown in all of the charts are due to the limited sample rate used at the moment, only 2 data points per second. In future I plan to increase this to 20 data points per second, if the hardware allows.
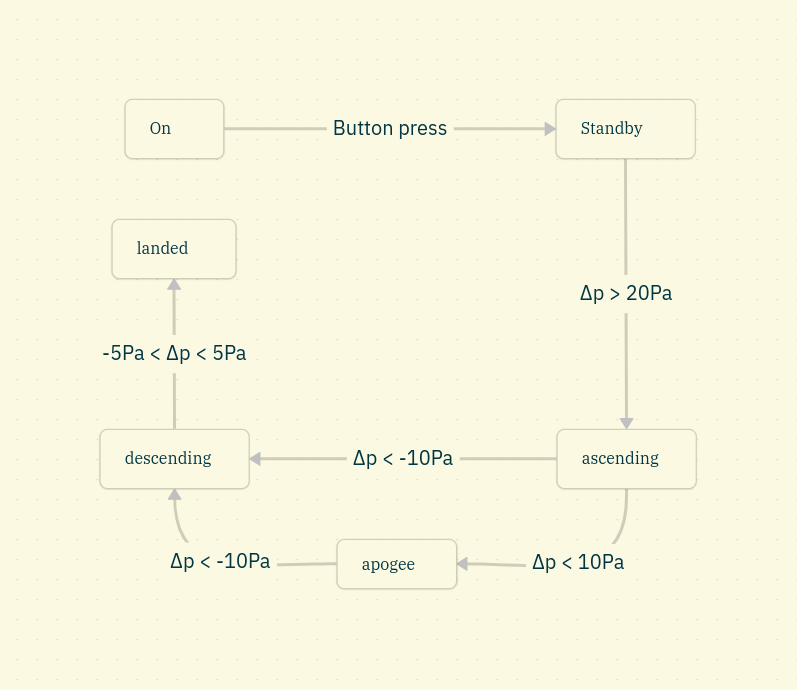
One problem I encountered was stopping data recording when the rocket was landed. The internal flash on the ESP32 is relatively small (8 megabytes), so I couldn’t rely on a button press as a way to end the flight. I solved this problem by utilising a state system. This divides the flight into its stages (Standby, Ascending, Apogee, Descending, and Landed) and changes what the firmware can do in each state. In this case, when it has decided it has landed the file will be saved and closed.
Leave a Reply